
The additional reporting metrics are:
- Categories
- VM uuid
Script still uses either Prism Element (the actual NutanixCluster) as source or both Prism Element and Prism Central. When using Prism Central you’ll get the following additional information:
- VM Create Date
- VM vNUMA Configuration
- VM Categories
- Self Service Portal Project
- Self Service Portal VM Owner
PC information or not is still controlled in the PC information section of the script and you specify Y or N if you want the information or not.
# Is Prism central in use. Available options are Y and N
pcinuse=”Y”
pcfqdn=”PC-FQDN”
pcuser=”User”
pcpasswd=”Password”
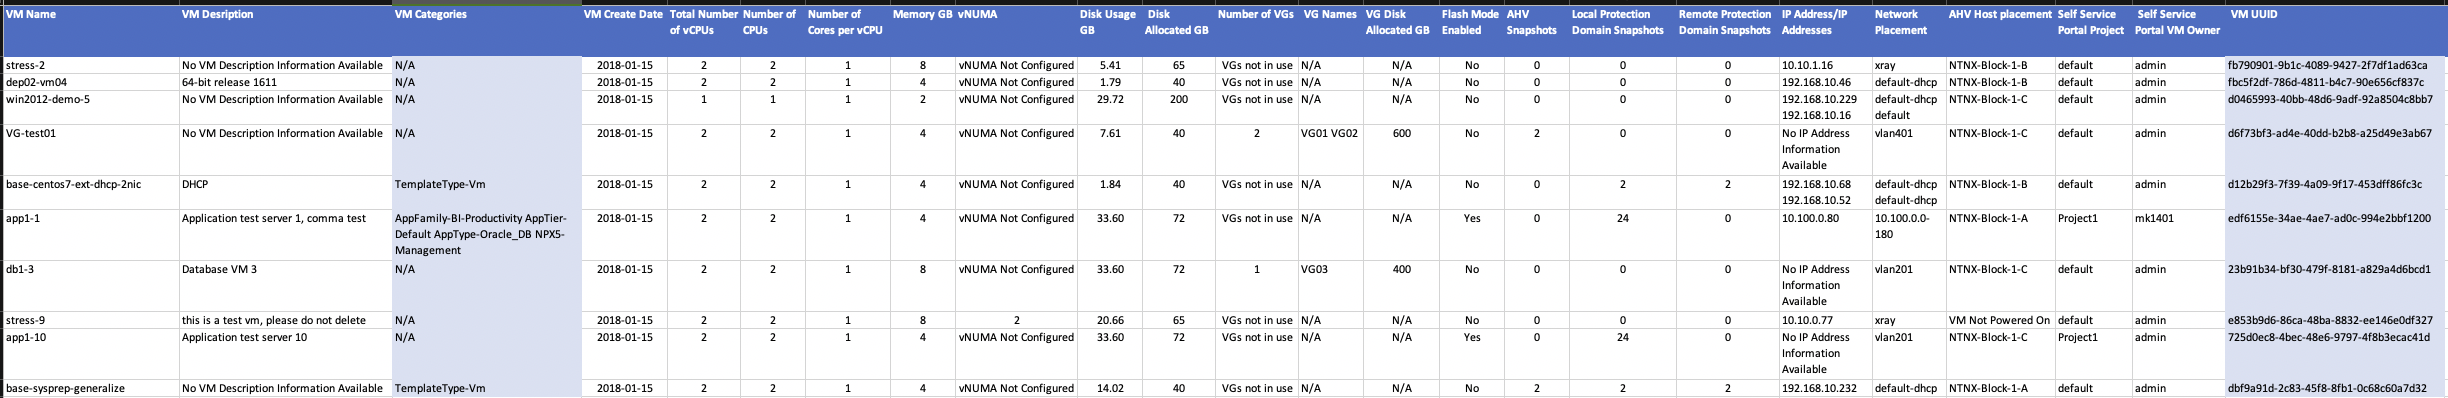
This means the report script includes the following metrics:
- VM Name
- VM Description
- VM Categories
- VM Create Date
- Total Number of vCPUs
- Number of CPUs
- Number of Cores per vCPU
- Memory GB
- vNUMA
- Disk Usage GB (not including CD-ROM)
- Disk Allocated GB (not including CD-ROM)
- Number of VGs
- VG Names
- VG Disk Allocated GB
- Flash Mode Enabled
- AHV Snapshots
- Local Protection Domain Snapshots
- Remote Protection Domain Snapshots
- IP Address/IP Addresses
- Network Placement
- AHV Host placement
- Self Service Portal Project
- Self Service Portal VM Owner
- VM uuid
Sample output from the script after some excel magic and the two new column are highlighted in a light blue color:)
After downloading the script from My GitHub Reporting Repository you need to change the following parameters to make it work in your environment:
- directory
- clusterfqdn
- user
- passwd
- pcinuse
- pcfqdn
- pcuser
- pcpasswd
The script has been tested with Nutanix AOS 5.10 & Nutanix AHV 20170830.171 running from a MacBook (Mojave). You might experience a slight difference in the script output when running from e.g. some Linux distributions.
Feel free to provide feedback for improvements if you have any suggestions.
3 pings